
Los Angeles, CA
Los Angeles fix and flip market report
Nov 2025 to Oct 2026 · Issued November 2026
Detached, attached, condo. Closed transactions, ≥30% margin.
Market pulse
- Fix and flips
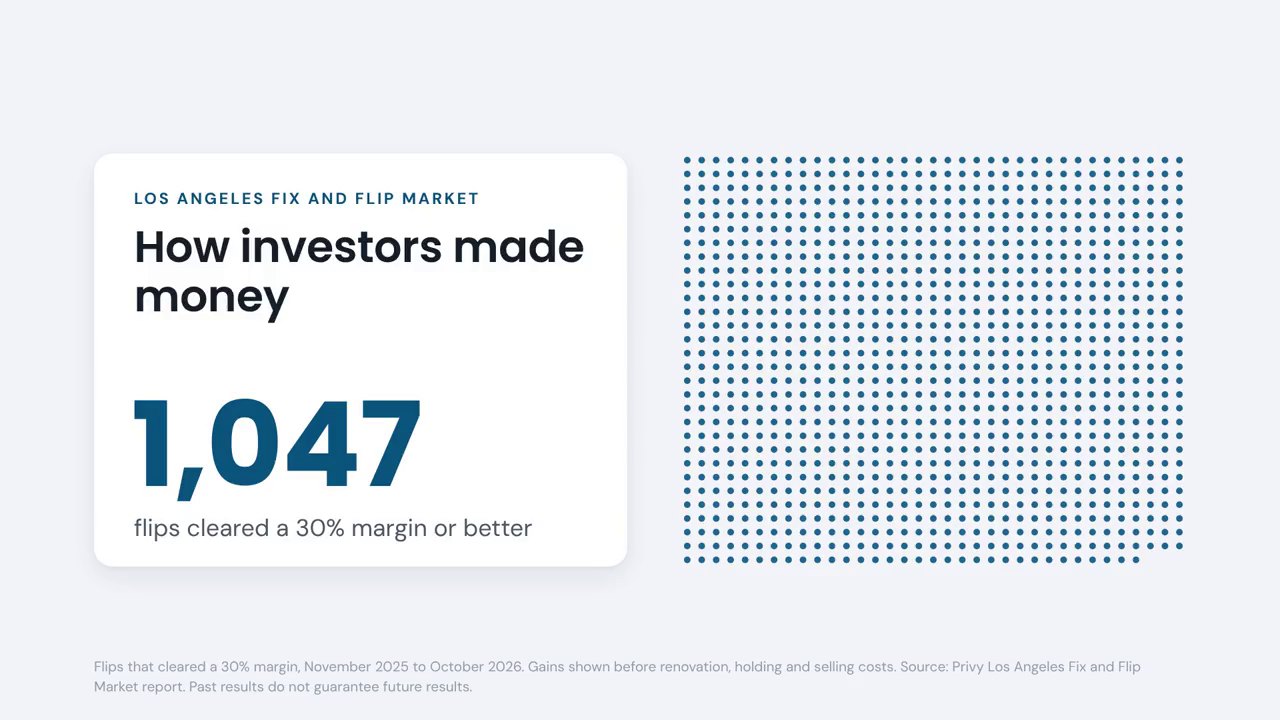
- 1,047
- Closed transactions, ≥30% margin
- Exit sales volume
- $1534.5M
- Aggregate resale dollars
- Gross flipper profit
- $595.1M
- $568K average per deal
- Median gain
- 51%
- Well above the 30% threshold
The typical flip
Bought a single family home for $750K through the MLS. Sold for $1.2M about 8 months later. $392K gross profit at a 51% gain.
- Property type
- 89% SFR
- 931 of 1,047. Condos 7%, attached 4%.
- Median hold
- 249 days
- 8.2 months. Typical hold time.
- Median gain
- 51%
- Well above the 30% qualifying threshold.
- Exit channel
- 92% MLS
- 962 of 1,047 flips exited on the MLS.
Monthly activity
Los Angeles fix and flip activity ranged from 61 flips in Jan to 112 in May.
- Nov: 72 flips
- Dec: 95 flips
- Jan: 61 flips
- Feb: 86 flips
- Mar: 93 flips
- Apr: 93 flips
- May: 112 flips
- Jun: 102 flips
- Jul: 88 flips
- Aug: 77 flips
- Sep: 85 flips
- Oct: 83 flips
On market vs off market
On market acquisition
638 flips · 61% of flips
- Median acquisition price
- $827,000
- Median resale price
- $1,275,000
- Median gross profit
- $431,000
- Median gain
- 50%
- Gain range (p25 / p75)
- 40% / 68%
- Median hold
- 262 days
Off market acquisition
409 flips · 39% of flips
- Median acquisition price
- $605,000
- Median resale price
- $955,000
- Median gross profit
- $330,000
- Median gain
- 52%
- Gain range (p25 / p75)
- 41% / 74%
- Median hold
- 226 days
Los Angeles splits 61/39 on-market to off-market in this window. On-market flips earn a median $431,000 over 262 days; off-market flips earn $330,000 over 226 days.
Where flips are happening
The top 9 ZIPs account for 27% of flip activity in this window.
| ZIP code | Neighborhood | Flips |
|---|---|---|
| 90047 | South Los Angeles | 45 |
| 90043 | Hyde Park | 41 |
| 90016 | Mid City | 30 |
| 90066 | Mar Vista | 30 |
| 91367 | Woodland Hills | 29 |
| 90003 | Southeast Los Angeles | 26 |
| 90008 | Crenshaw | 26 |
| 91342 | Not listed | 26 |
| 90044 | Not listed | 25 |
Price tiers
The $1M to $1.5M range captures 31% of all deals.
- Under $500K
- 20 flips · 2%
- $500K to $750K
- 158 flips · 15%
- $750K to $1M
- 227 flips · 22%
- $1M to $1.5M
- 322 flips · 31%
- $1.5M+
- 320 flips · 31%
Rehab patterns
- Bedroom added
- 328 · 31%
- 328 of 1,047 flips added at least one bedroom.
- Bathroom added
- 427 · 41%
- 427 of 1,047 flips added at least one bathroom.
- Sqft expansion
- 248 · 24%
- 248 of 1,047 flips grew their square footage, by a median of 495 sqft.
Flipper concentration
- Unique flippers
- 863
- Average
- 1.2 deals per flipper
- 1 deal
- 785 investors · 91%
- 2 deals
- 48 investors · 6%
- 3 deals
- 13 investors · 2%
- 4+ deals
- 17 investors · 2%
How flips were financed
- Unique acquisition lenders
- 221
- All-cash acquisitions
- 484 flips (46%)
- Average construction loan
- $1.0M
- Typical term
- 12 months
- Typical rate range
- 6.3% to 6.8%
Takeaways
On-market flips pay more per deal; off-market flips move faster.
On-market flips in Los Angeles hold for 262 days and earn a median $431,000. Off-market flips hold for 226 days and earn $330,000. 61% of flips were bought on the MLS.
Bathroom additions lead the rehab playbook.
41% of flips (427 deals) added at least one bathroom; 31% of flips (328 deals) added at least one bedroom; 24% of flips (248 deals) grew their square footage, by a median of 495 sqft.
ZIPs 90047 and 90043 lead Los Angeles's flip activity.
The top 9 ZIPs, led by 90047 (South Los Angeles) with 45 flips and 90043 (Hyde Park) with 41, account for 27% of all activity. Concentration shows where capital is finding returns, and where competition is highest.
Source: Privy Los Angeles Fix and Flip Market report. Flips counted are resales that closed between Nov 2025 and Oct 2026, sold at least 30% above the purchase price, and held 18 months or less. Data as of Nov 2026.
See what's happening around your ZIP
Enter your ZIP. We'll email you the flips investors finished within 3 miles of it: what they paid, what they sold for and how long it took, plus the homes for sale nearby that look the same. Free.